Introduction: Why Dstat L4 Deserves Your Attention
You know what’s interesting? Most system admins, developers, and even DevOps engineers spend years staring at system metrics but still feel blind when something suddenly slows down. We’ve all been there. A server feels “off,” users complain about latency, and your usual monitoring dashboard just shrugs.
And that’s where dstat l4 quietly walks in like, “Hey, want to see what’s actually happening?”
To be honest, dstat itself isn’t new. But the Layer 4 (L4) capability inside dstat? That’s where things get spicy. It lets you peek into transport-layer behavior — TCP and UDP activity — without complex tools, expensive software, or configuration nightmares.
So if you’ve ever wondered:
- Why your network feels slow even when bandwidth looks fine
- How many active TCP connections are hammering your system
- Or how to monitor Layer 4 traffic in real time
Trust me, you’ll see why dstat l4 deserves a permanent spot in your toolbox.
What Is Dstat? A Quick Refresher
Before we zoom into dstat l4, let’s step back for a moment.
Dstat is a command-line system monitoring tool for Linux that combines features from:
- vmstat
- iostat
- netstat
- ifstat
All in one clean, real-time interface.
But unlike older tools, dstat:
- Updates live
- Shows correlated metrics
- Uses plugins for extended functionality
And yes, Layer 4 monitoring is one of those plugins that many people completely overlook.
Understanding Layer 4 (L4) Monitoring
What Is Layer 4 in Simple Terms?
Layer 4 refers to the Transport Layer of the OSI model. This is where:
- TCP (Transmission Control Protocol)
- UDP (User Datagram Protocol)
do their work.
In plain English, Layer 4 decides how data is delivered, not just how much data is sent.
So while bandwidth tells you how big the pipe is, Layer 4 tells you:
- How many connections are flowing
- Whether packets are being dropped
- If retransmissions are happening
And that’s crucial.
What Is Dstat L4 Exactly?
Dstat L4 is a plugin within dstat that provides real-time visibility into Layer 4 network statistics, including:
- Active TCP connections
- TCP listen states
- UDP socket usage
- Connection counts per second
And the best part?
It does all this without needing Wireshark, tcpdump, or external monitoring stacks.
So yeah, lightweight but powerful.
Why Dstat L4 Matters More Than You Think
Let’s be honest. Most performance issues don’t start at Layer 1 or 2. They show up at Layer 4.
Common Problems Dstat L4 Helps You Catch
- Sudden spike in TCP connections
- SYN flood-like behavior
- UDP overload from streaming apps
- Application connection leaks
- Backend services exhausting ports
And the scary part?
Bandwidth graphs often look perfect while these issues burn your system.
That’s why dstat l4 monitoring is such a lifesaver.
Installing Dstat (If You Don’t Have It Yet)
Most Linux distributions already include dstat.
Ubuntu / Debian
sudo apt install dstat
CentOS / RHEL
sudo yum install dstat
Simple. No drama.
How to Enable and Use Dstat L4
Here’s where things get exciting.
Basic Dstat Command
dstat
That’s fine, but it won’t show Layer 4 stats.
Using Dstat L4 Plugin
dstat --tcp --udp
Boom. You now have:
- TCP connection counts
- UDP socket activity
- Real-time updates every second
And yes, it works beautifully over SSH.
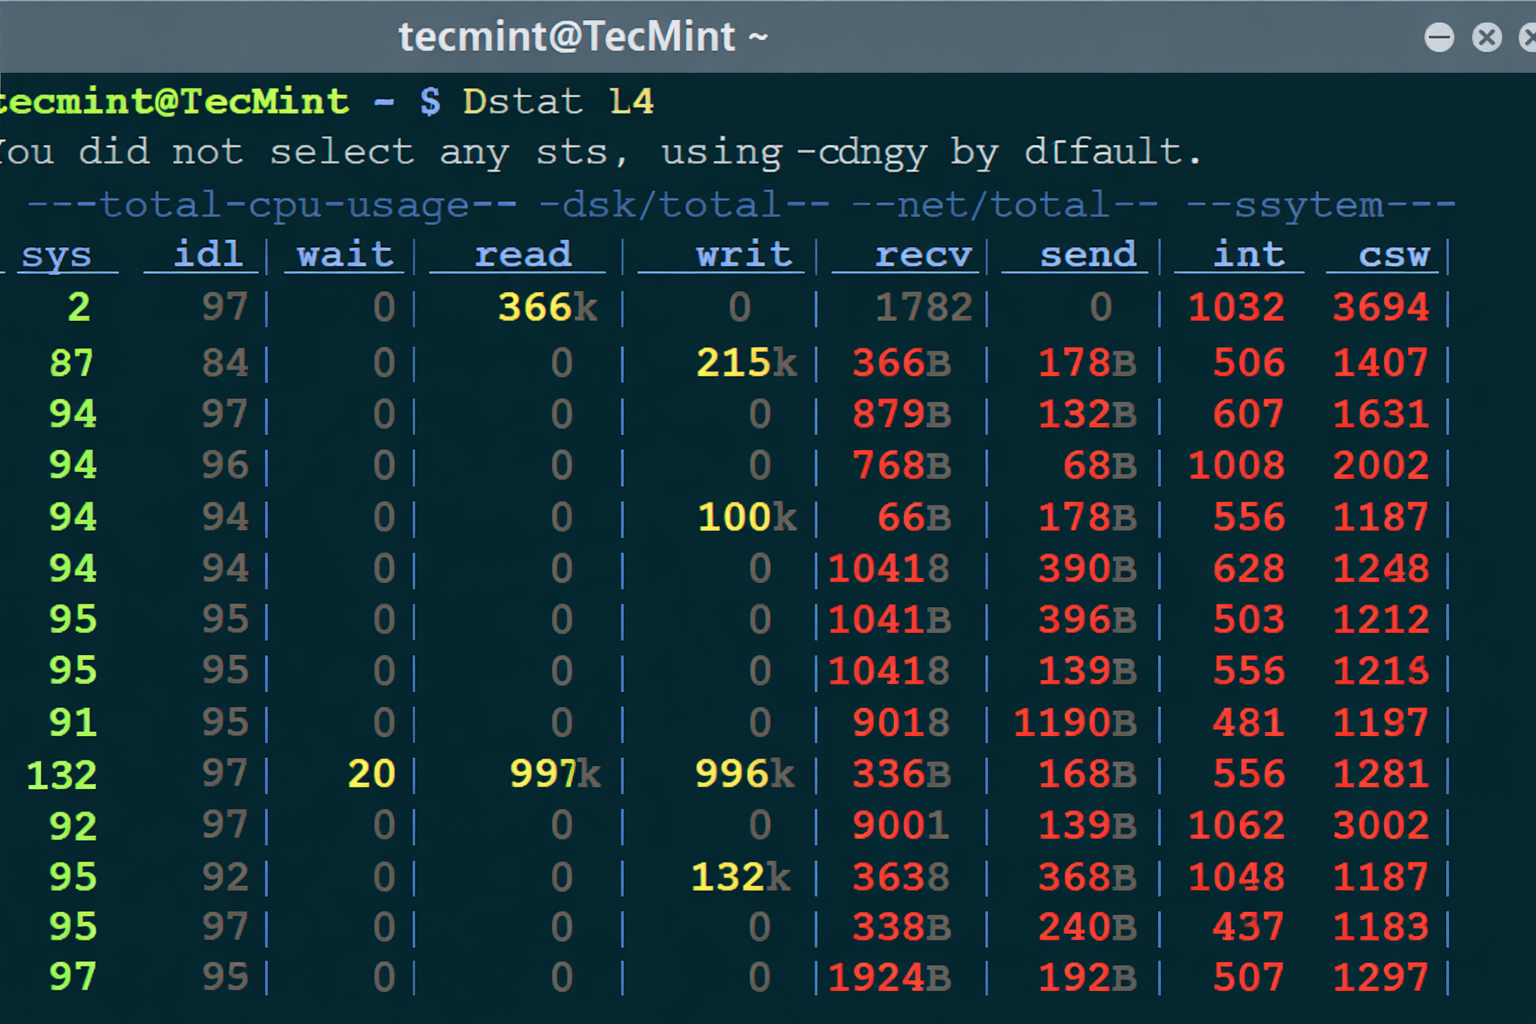
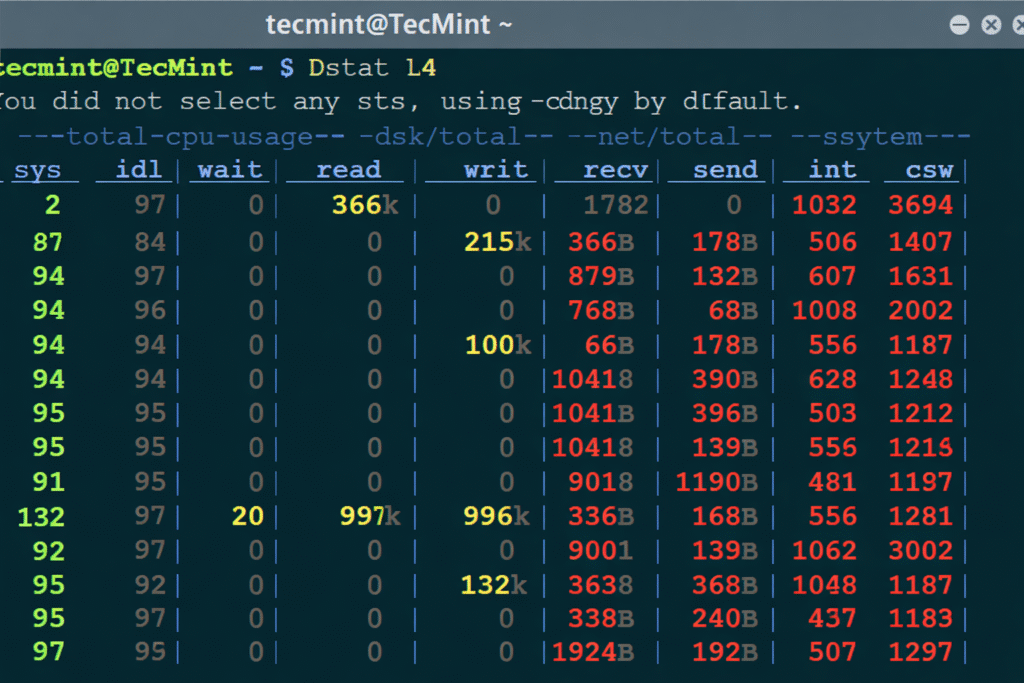
Breaking Down Dstat L4 Output
Let’s talk about what you’re seeing, because raw numbers without context are just noise.
TCP Metrics Explained
You’ll typically see:
- established – active TCP connections
- listen – services waiting for connections
- syn – half-open connections
A sudden rise in syn?
That’s a red flag.
UDP Metrics Explained
UDP stats show:
- Active UDP sockets
- Incoming/outgoing packet activity
If UDP usage spikes unexpectedly, something — maybe a media service or DNS issue — is hammering your system.
Real-World Example: Diagnosing a Slow API
Let me paint a picture.
A production API starts timing out. CPU is fine. Memory is stable. Network bandwidth looks normal.
So what’s wrong?
You run:
dstat --tcp
And suddenly you see:
- Thousands of TCP connections stuck in ESTABLISHED
- Very few closing properly
Turns out, the app wasn’t releasing connections.
Problem found. Crisis avoided.
That’s dstat l4 in action.
Comparing Dstat L4 With Other Tools
Dstat L4 vs Netstat
- Netstat: snapshot
- Dstat L4: live stream
Dstat L4 vs ss
- ss: detailed but manual
- Dstat L4: continuous monitoring
Dstat L4 vs Wireshark
- Wireshark: deep packet analysis
- Dstat L4: fast, lightweight, server-friendly
So yeah, different tools — different jobs.
Best Use Cases for Dstat L4
Here’s where dstat l4 monitoring really shines:
- Production servers
- Cloud VMs
- Containers & microservices
- Load balancer nodes
- API gateways
Basically, anywhere connections matter more than bandwidth.
Tips for Using Dstat L4 Effectively
You know what makes tools powerful? How you use them.
Tip 1: Combine With Other Metrics
dstat --tcp --udp --cpu --mem
Now you’re correlating network behavior with system load.
Tip 2: Watch Trends, Not Just Spikes
A slow leak is often worse than a sudden spike.
Tip 3: Use It During Deployments
After deployments, watch Layer 4 behavior closely.
Trust me on this one.
Common Mistakes to Avoid
Let’s save you some frustration.
- ❌ Ignoring UDP because “it’s unreliable”
- ❌ Watching bandwidth instead of connections
- ❌ Running dstat l4 too late (after the incident)
Monitoring is about prevention, not panic.
Is Dstat L4 Safe for Production Servers?
Short answer? Yes.
Dstat is:
- Read-only
- Lightweight
- Non-intrusive
It doesn’t modify traffic or system behavior.
So you can safely run dstat l4 on live systems.
Advanced Usage: Logging Dstat L4 Output
Want to save output for later analysis?
dstat --tcp --udp --output l4_stats.csv
Now you’ve got:
- Historical data
- Trend analysis
- Proof during post-mortems
And yes, CSV opens nicely in Excel.
Why Dstat L4 Still Matters in the Cloud Era
Some people think cloud monitoring makes tools like dstat obsolete.
But honestly? That’s not true.
Cloud dashboards:
- Abstract details
- Lag behind real time
- Hide Layer 4 behavior
Dstat l4 gives you raw truth, straight from the system.
Conclusion: Small Tool, Big Insight
So here we are.
Dstat L4 may not look flashy. It won’t draw graphs or send alerts. But when things go wrong — and they always do — it tells you the truth faster than most tools ever will.
If you care about:
- Performance
- Stability
- Understanding your systems
Then learning and using dstat l4 isn’t optional anymore.
Give it a try. Watch your connections. And you’ll never troubleshoot blind again.
FAQs About Dstat L4
What does dstat l4 monitor exactly?
Dstat l4 monitors transport-layer activity, mainly TCP and UDP connections, in real time.
Is dstat l4 suitable for beginners?
Yes. The commands are simple, and the output is easy to understand with basic networking knowledge.
Can dstat l4 replace Wireshark?
No. Dstat l4 shows connection behavior, while Wireshark analyzes individual packets. They serve different purposes.
Does dstat l4 impact system performance?
Minimal impact. It’s lightweight and safe for production use.